
ETH Oracle Report - 2026-01-31

Signal Summary
POSITION
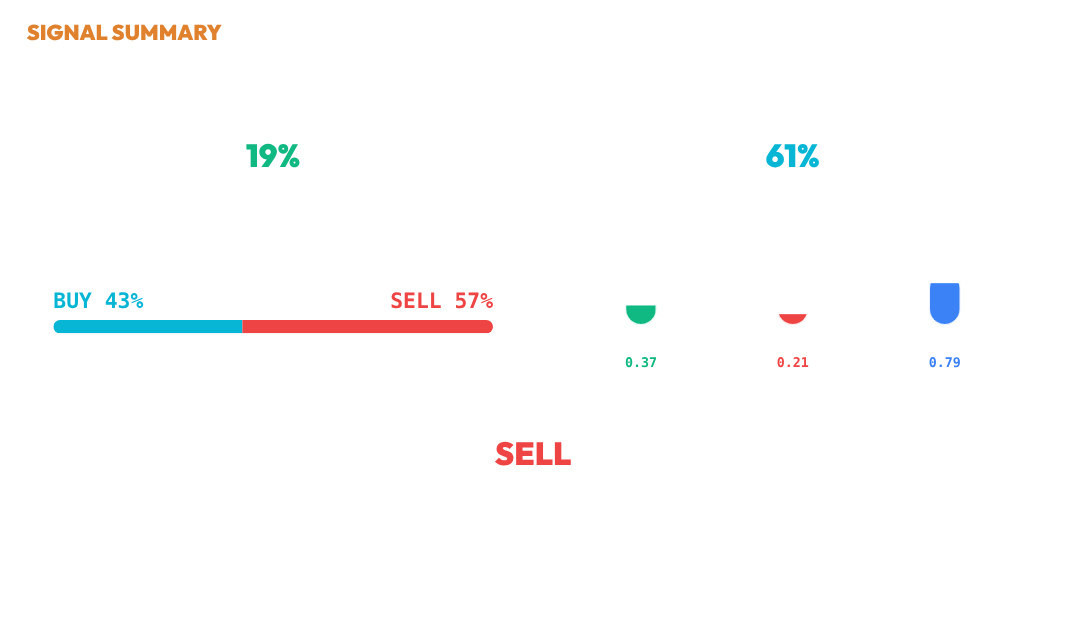
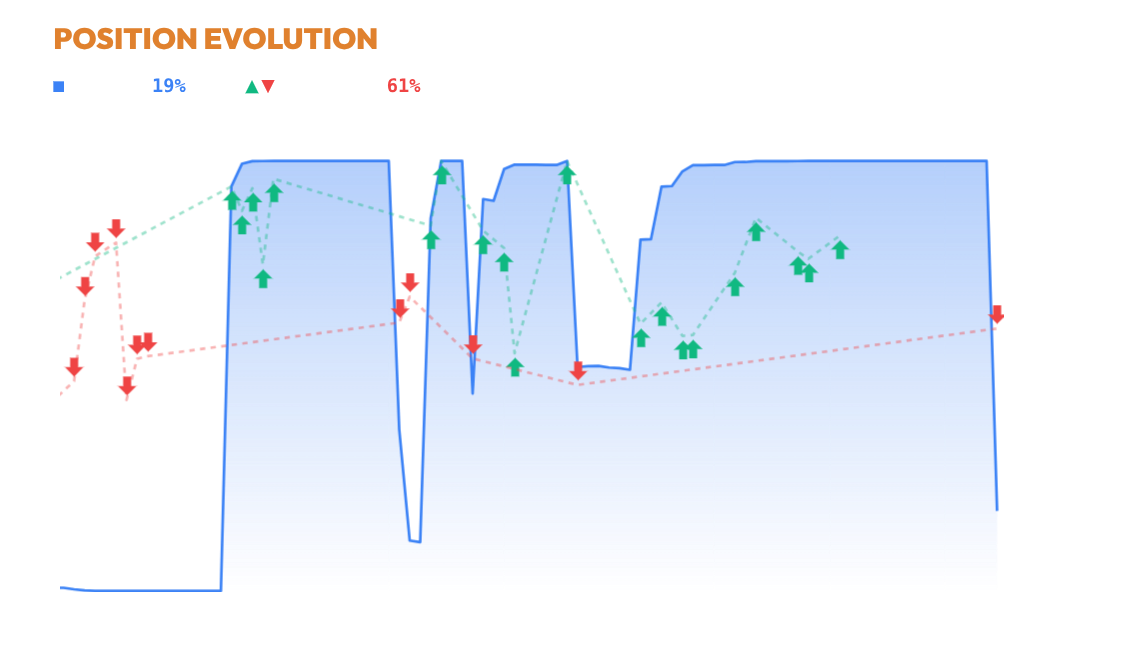
Exposure stands at 18.6% as of January 28, following a significant sell action that reduced allocation from 100% to 18.6%. The blue exposure line shows a sharp decline from near full exposure to a much lower level. The system has transitioned to a more cash-heavy position, reflecting a substantial reduction in allocation.
CHART
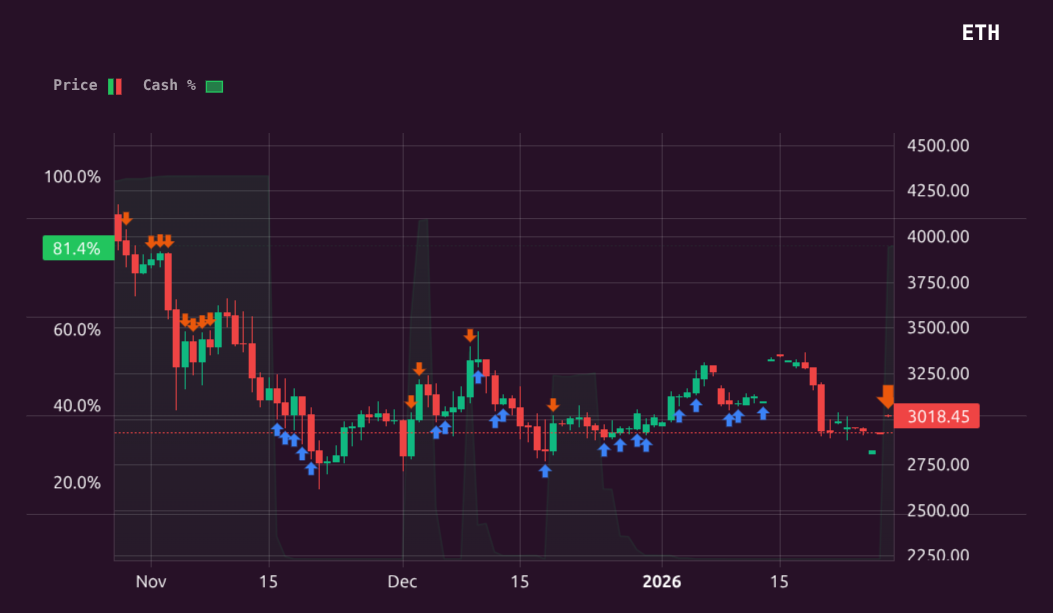
Over the past three months, the price of ETH experienced a notable decline initially, followed by a period of consolidation and slight recovery. This volatility was mirrored in the system's trading decisions, which showed frequent buying activity from late December through mid-January, with confidence levels generally above 60%. The strategic shift to a SELL position on January 28, with a moderate confidence of 0.45, reflects a response to the recent downturn in price. Allocation adjusted accordingly, with a high cash position of 81.4%, indicating a cautious stance. The current allocation suggests the system is prioritizing liquidity as ETH stabilizes around the $3000 mark. The chart reflects a period of tactical retrenchment as the price remains below recent highs.
REGIME
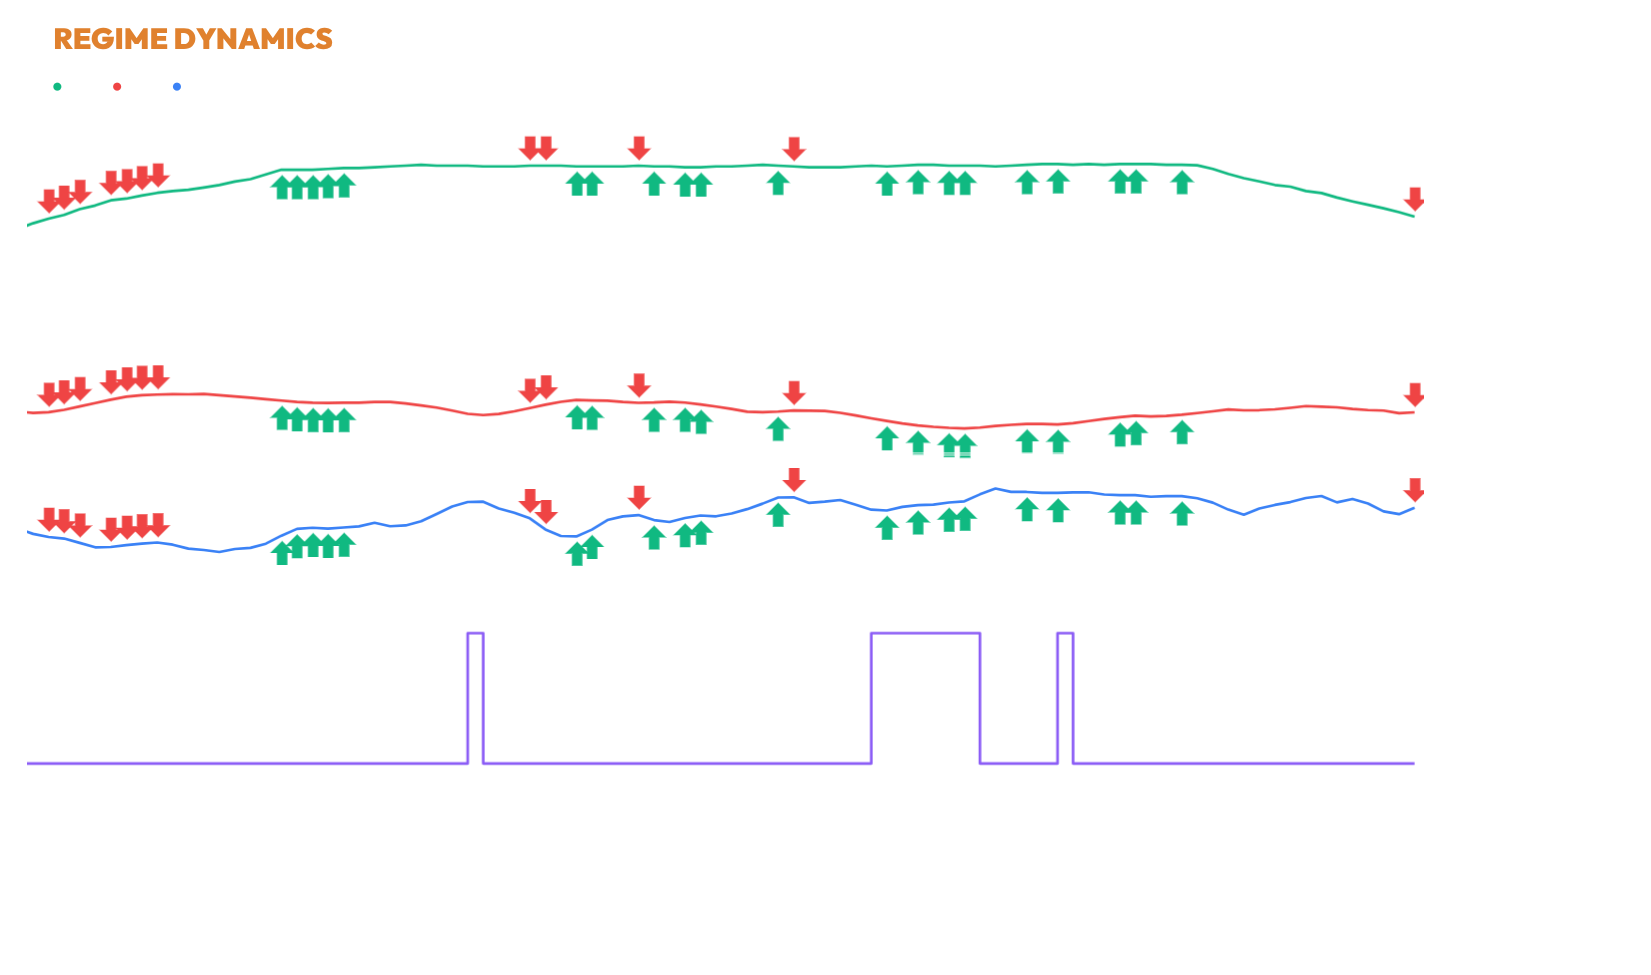
Material integrity is weak at 37.3%, showing a slight declining trend, indicating significant stress in price and volume structure. Energetic integrity is very weak at 20.9%, though it has a marginally positive trend, suggesting limited participation and volatility stability. Conversely, ethereal integrity is strong at 79.1%, with a positive trend indicating good momentum persistence. Within the CHOP regime, these dimensions highlight a market environment characterized by elevated noise and reduced coherence. The provided trade history does not allow a clear temporal linkage between execution and integrity changes. Overall, the market shows unstable conditions with strong momentum but weak price structure and participation.
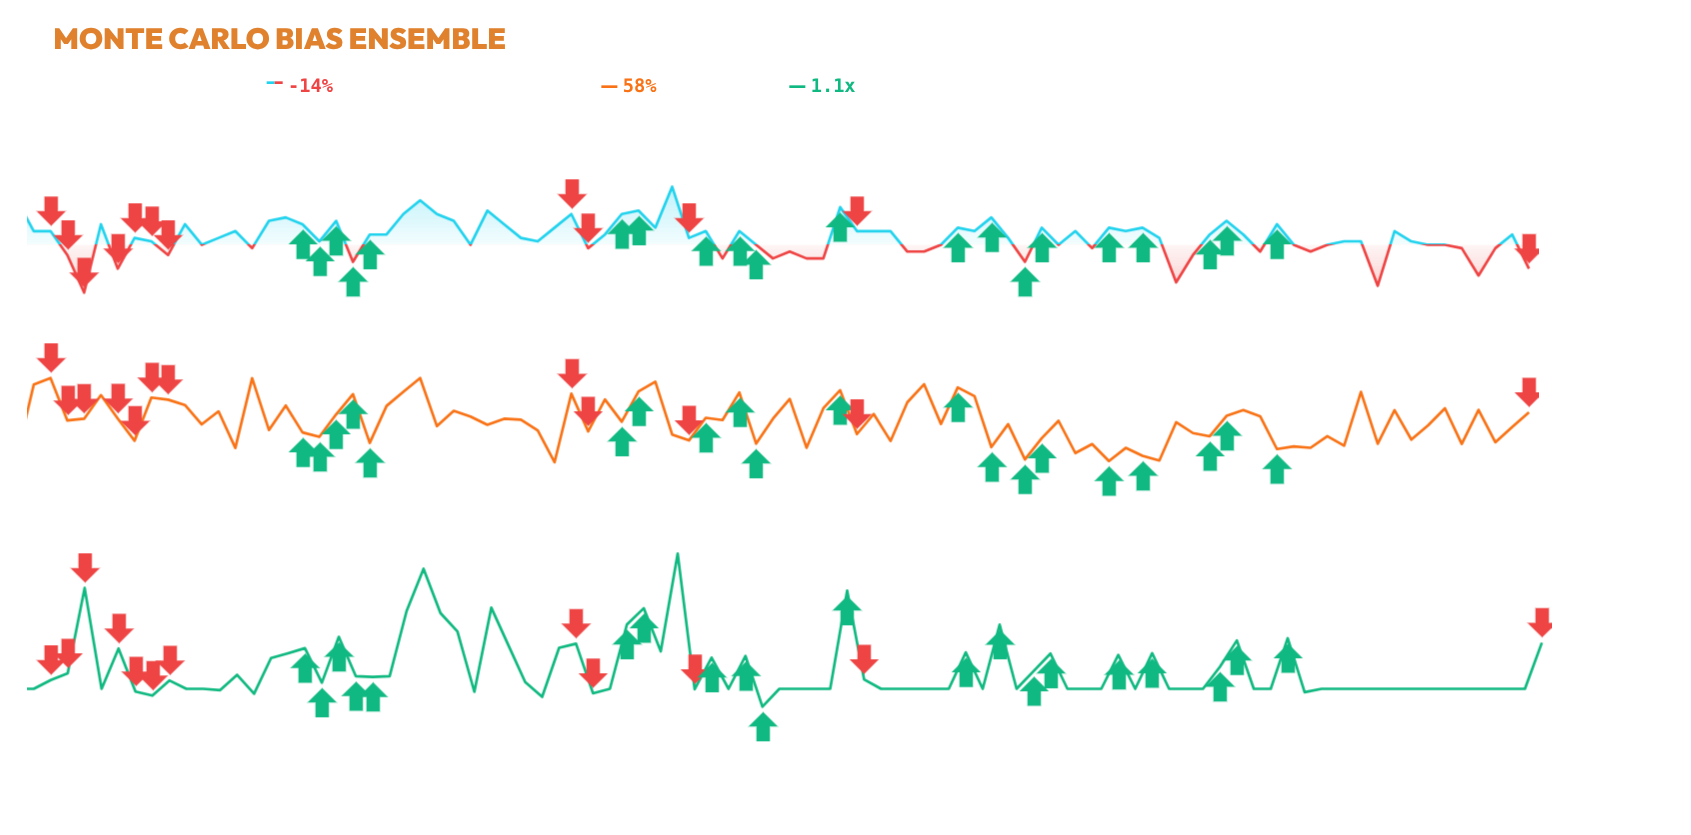
MCBIAS
The simulation conducted on 2026-01-28 with a 60-bar forward horizon using the SagaHalla Stochastic Ensemble model indicates a raw directional drift with a probability of 43.0% for buying and 57.0% for selling. The distribution spread, marked by an ensemble entropy of 0.99, suggests high agreement among the paths. The risk-adjusted confidence, after dispersion penalties, stands at 47.1%, with an MC sizing multiplier of 1.10x, indicating a slight increase in position sizing. Despite the MC bias towards selling, the final ensemble decision to sell aligns with this bias, but the exposure has decreased by 81.4% to 18.6%. Probabilistic simulations show a consistent negative bias, reinforcing the decision to reduce exposure.
DECISION
📊 Ensemble Consensus: SELL
[SellStats] z=1.14, Sharpe=-0.09, Hurst=0.62, ADX=20.0, AC=0.12 (x2)
[SellCalc] base=0.313, integ=0.79→0.85, vov=0.00→0.82 → conf=0.218 (x2)
[Filter] Min Ethereal Integrity=0.452, Max Volatility Stability=0.066, Ethereal Integrity=0.791, Volatility Stability=0.003 (x2)
[Ethereal Integrity] level=0.79, trend=+0.000 → ×1.00 (x2)
Statistical sell: z=1.14, sharpe=-0.09, vol_adj=1.02 (x2)
[Scenario statistical_sell] score=0.66 → +16.0% (x2)
[decision] 🔎 Material Integrity=37%, trend=+0.000, zone=fragile; 🔶 Fragile PI → mild sell bias; 📏 Conviction margin=0.015 (regime_integrity=0.79, integ_trend=+0.002, trend_dir=+1); 🟢 Stable regime (0.79); 🛡 Stable regime softener → sell conviction reduced (int=0.79, trend=+0.002); 📈 Trend-aligned BUY boost → (dir=+1, int=0.79, Δint=+0.002); ⚖️ Conviction Δ=-0.062 → dominance=-1.00; ✅ Confirmed SELL (MC=0.47) (x1)
✅ Action: SELL (conf=0.45) (x1)
📊 Shape Adj: 1.03x (skew=0.28, kurt=0.32) | 🧗 Tier Snap: 0.76 (conf=0.45 >= 0.35) | 🛡️ Structural Adj: 0.81x
transparency note: this report is generated by individual decision engines (price, regime, momentum, probability) and synthesized by a consensus logic layer. the 'verdict' is the raw output of that consensus. full methodology and live trace available in the execution logs.
Member discussion